Polymorphism
I want to expand on last post, because I think the last section touched on an interesting phenomena. It is summared by these two plots:
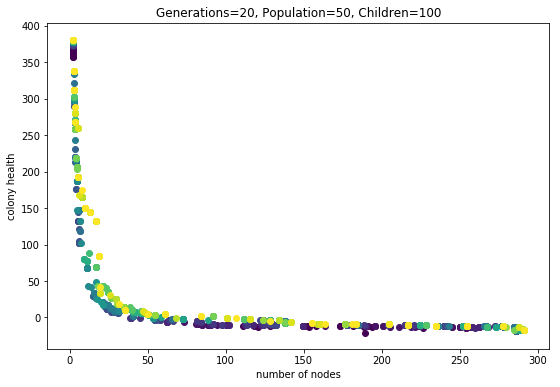
Fig1. This evolution run had three phenotype evaluations.
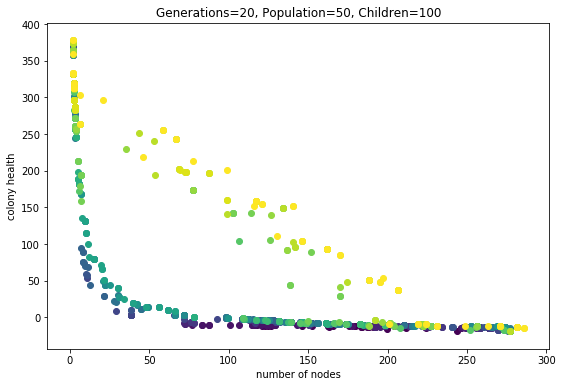
Fig2. This evolution run had seven phenotype evaluations. All else was equal.
What do I mean by “seven phenotype evaulations”? Each genotype (individual) is used to grow some number of phenotypes. Each phenotype is evaluated for fitness (in this case number-of-nodes and health). Then all the fitness scores are averaged, respectively.
What is the meaning of this multiple-phenotype expression? It’s as if multiple clones are being budded off of a single genome. It is making these ‘organisms’ behave as though they reproduce asexually and sexually. The sexual reproduction happens when child genomes are created during each round of the evolutionary algorithm. The asexuall reproduction is happening everytime the evaluation function operates, where it does multiple phenotype evaluations.
So what is the effect? One is that the pareto frontier can explode outwards, to higher average fitness. This is clearly seen in the last couple of generations in the second plot. Why are these individuals so much more fit? I think it is because they are exhibiting “polymorphism”. Poly means “many” and morphe means “form,” so in this context this is saying that a single genotype can exhibit many phenotypic forms. Since the fitness scores from these different forms are averaged, the genotype can more effectively find a niche on the pareto-frontier than a monomorphic genotype.
This is clearly seen in the follwing images. These depict one phenotype for each genome in the pareto-frontier of the final generation (the 20th). The average number of nodes and health is printed. Note this is not the same as the specific fitness for the phenotype you are looking at.
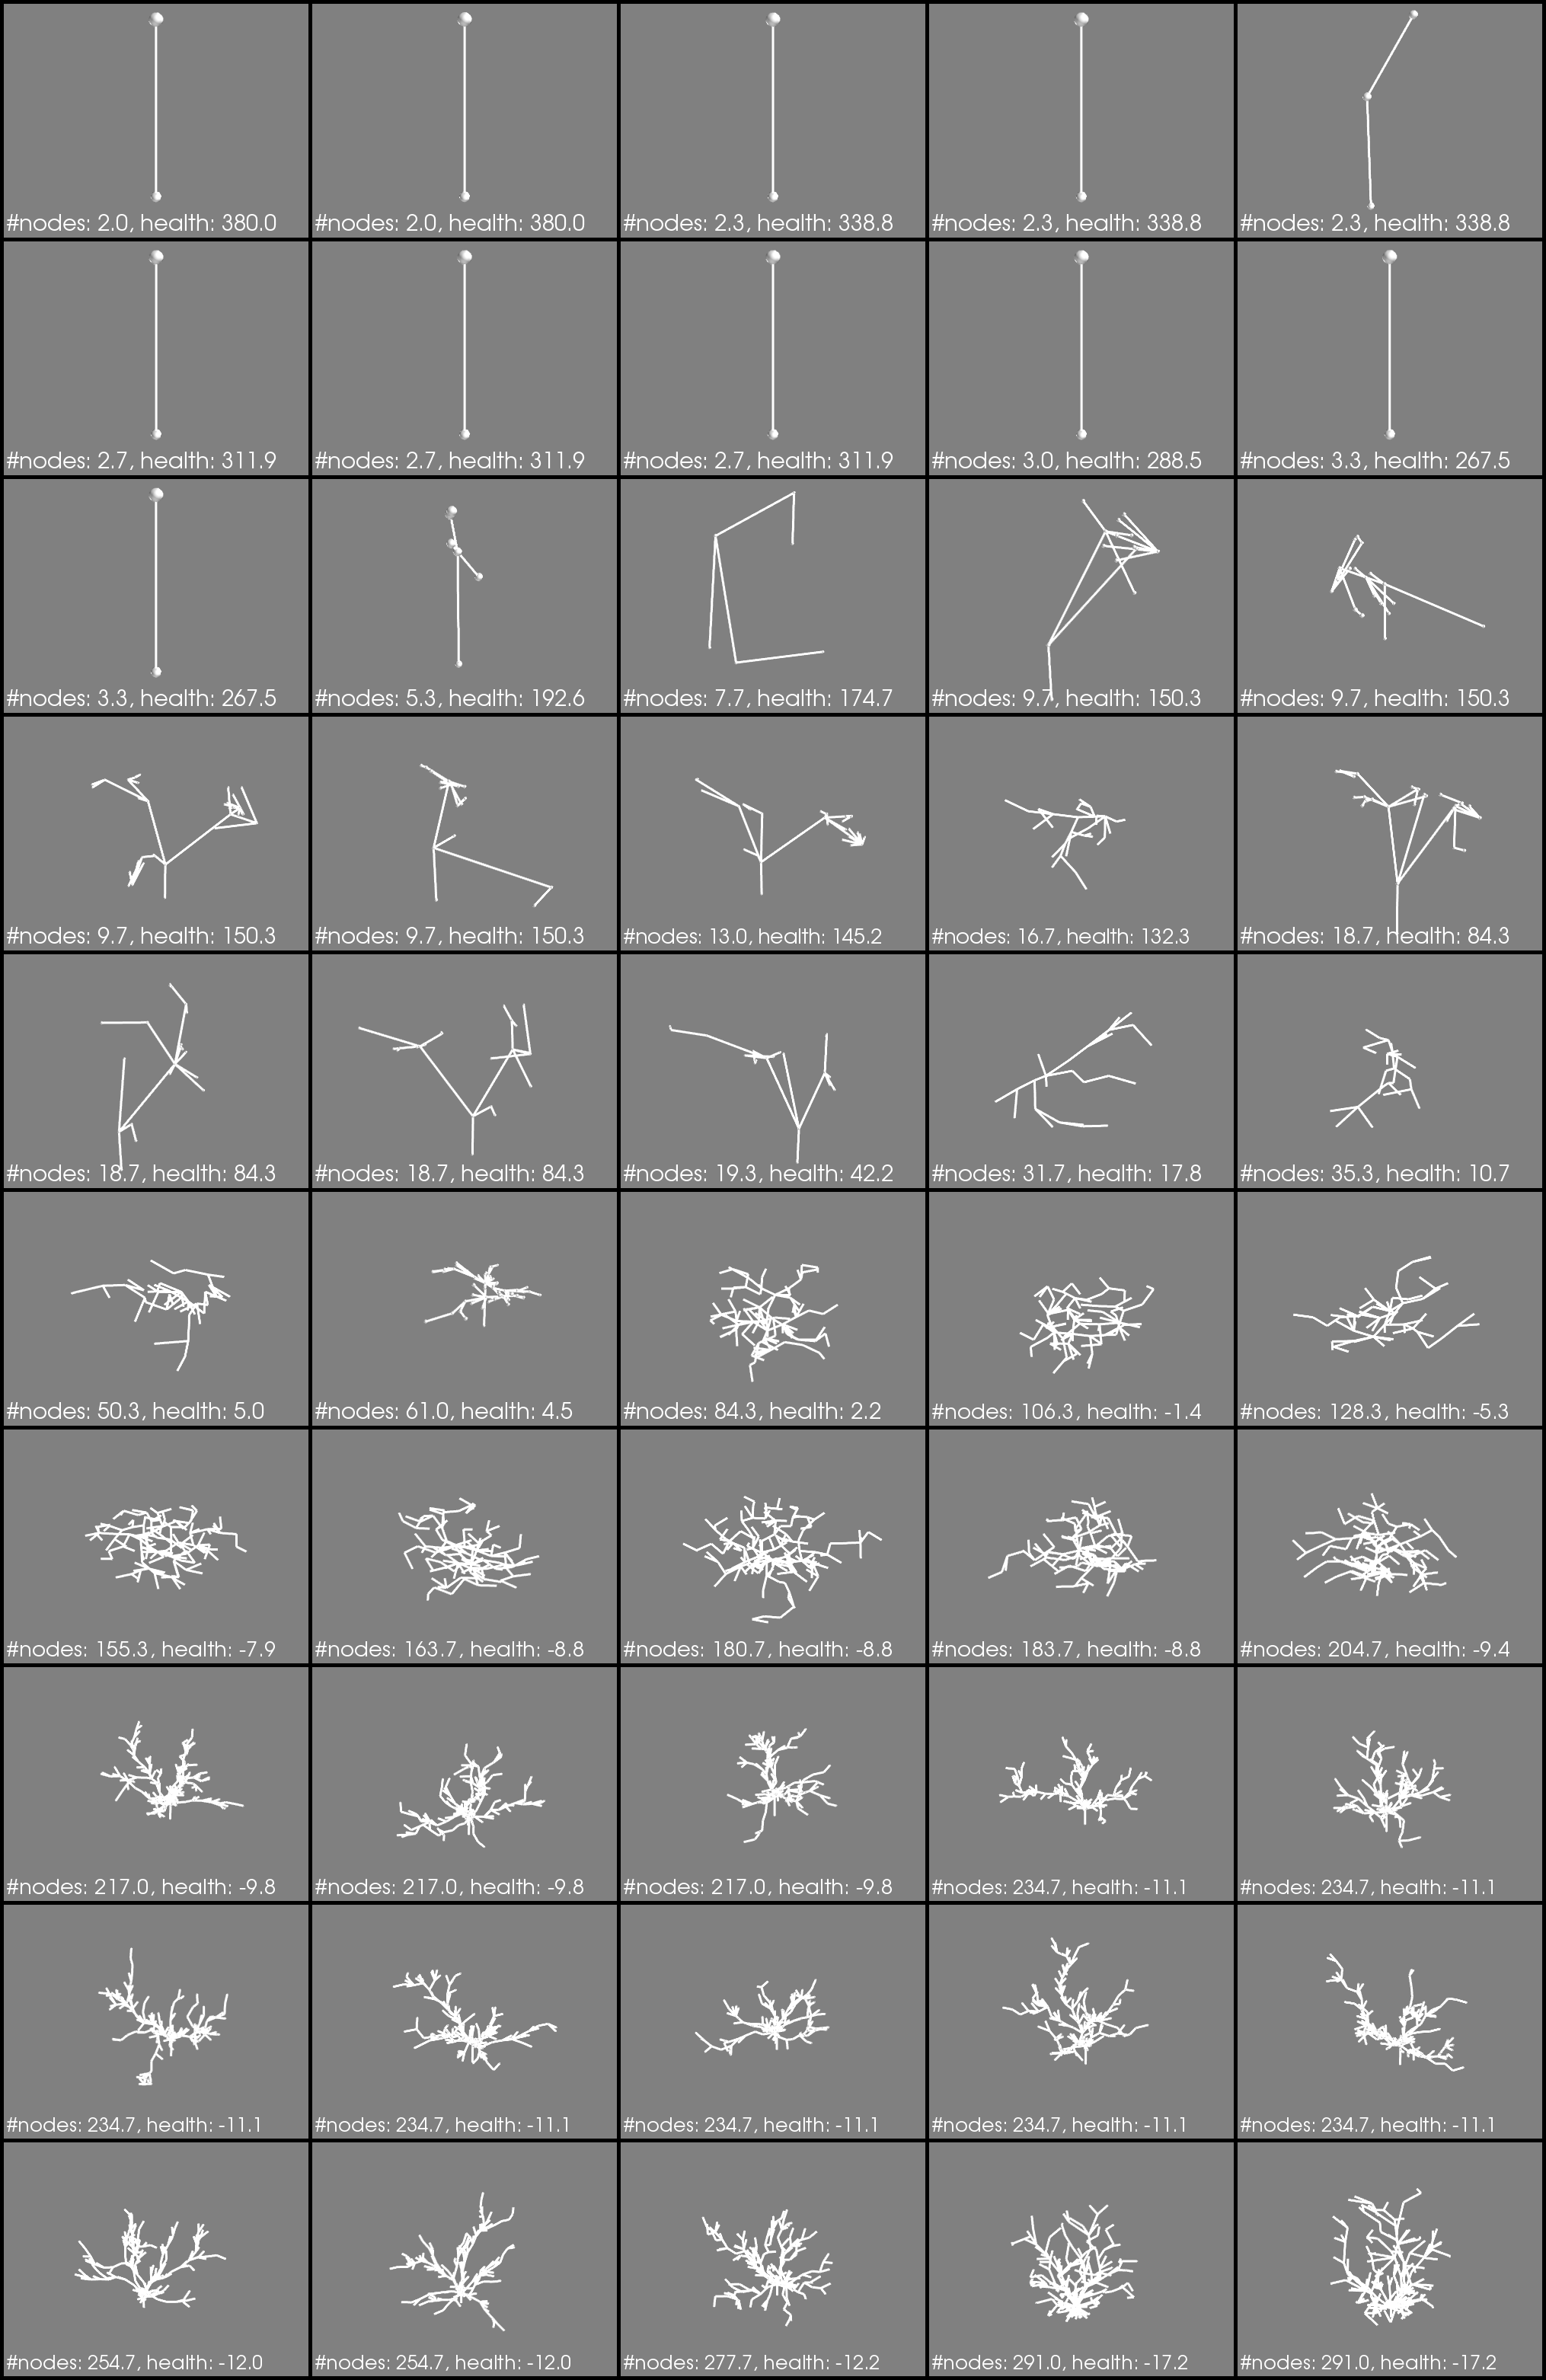
Fig3. Phenotype evaulations = 3
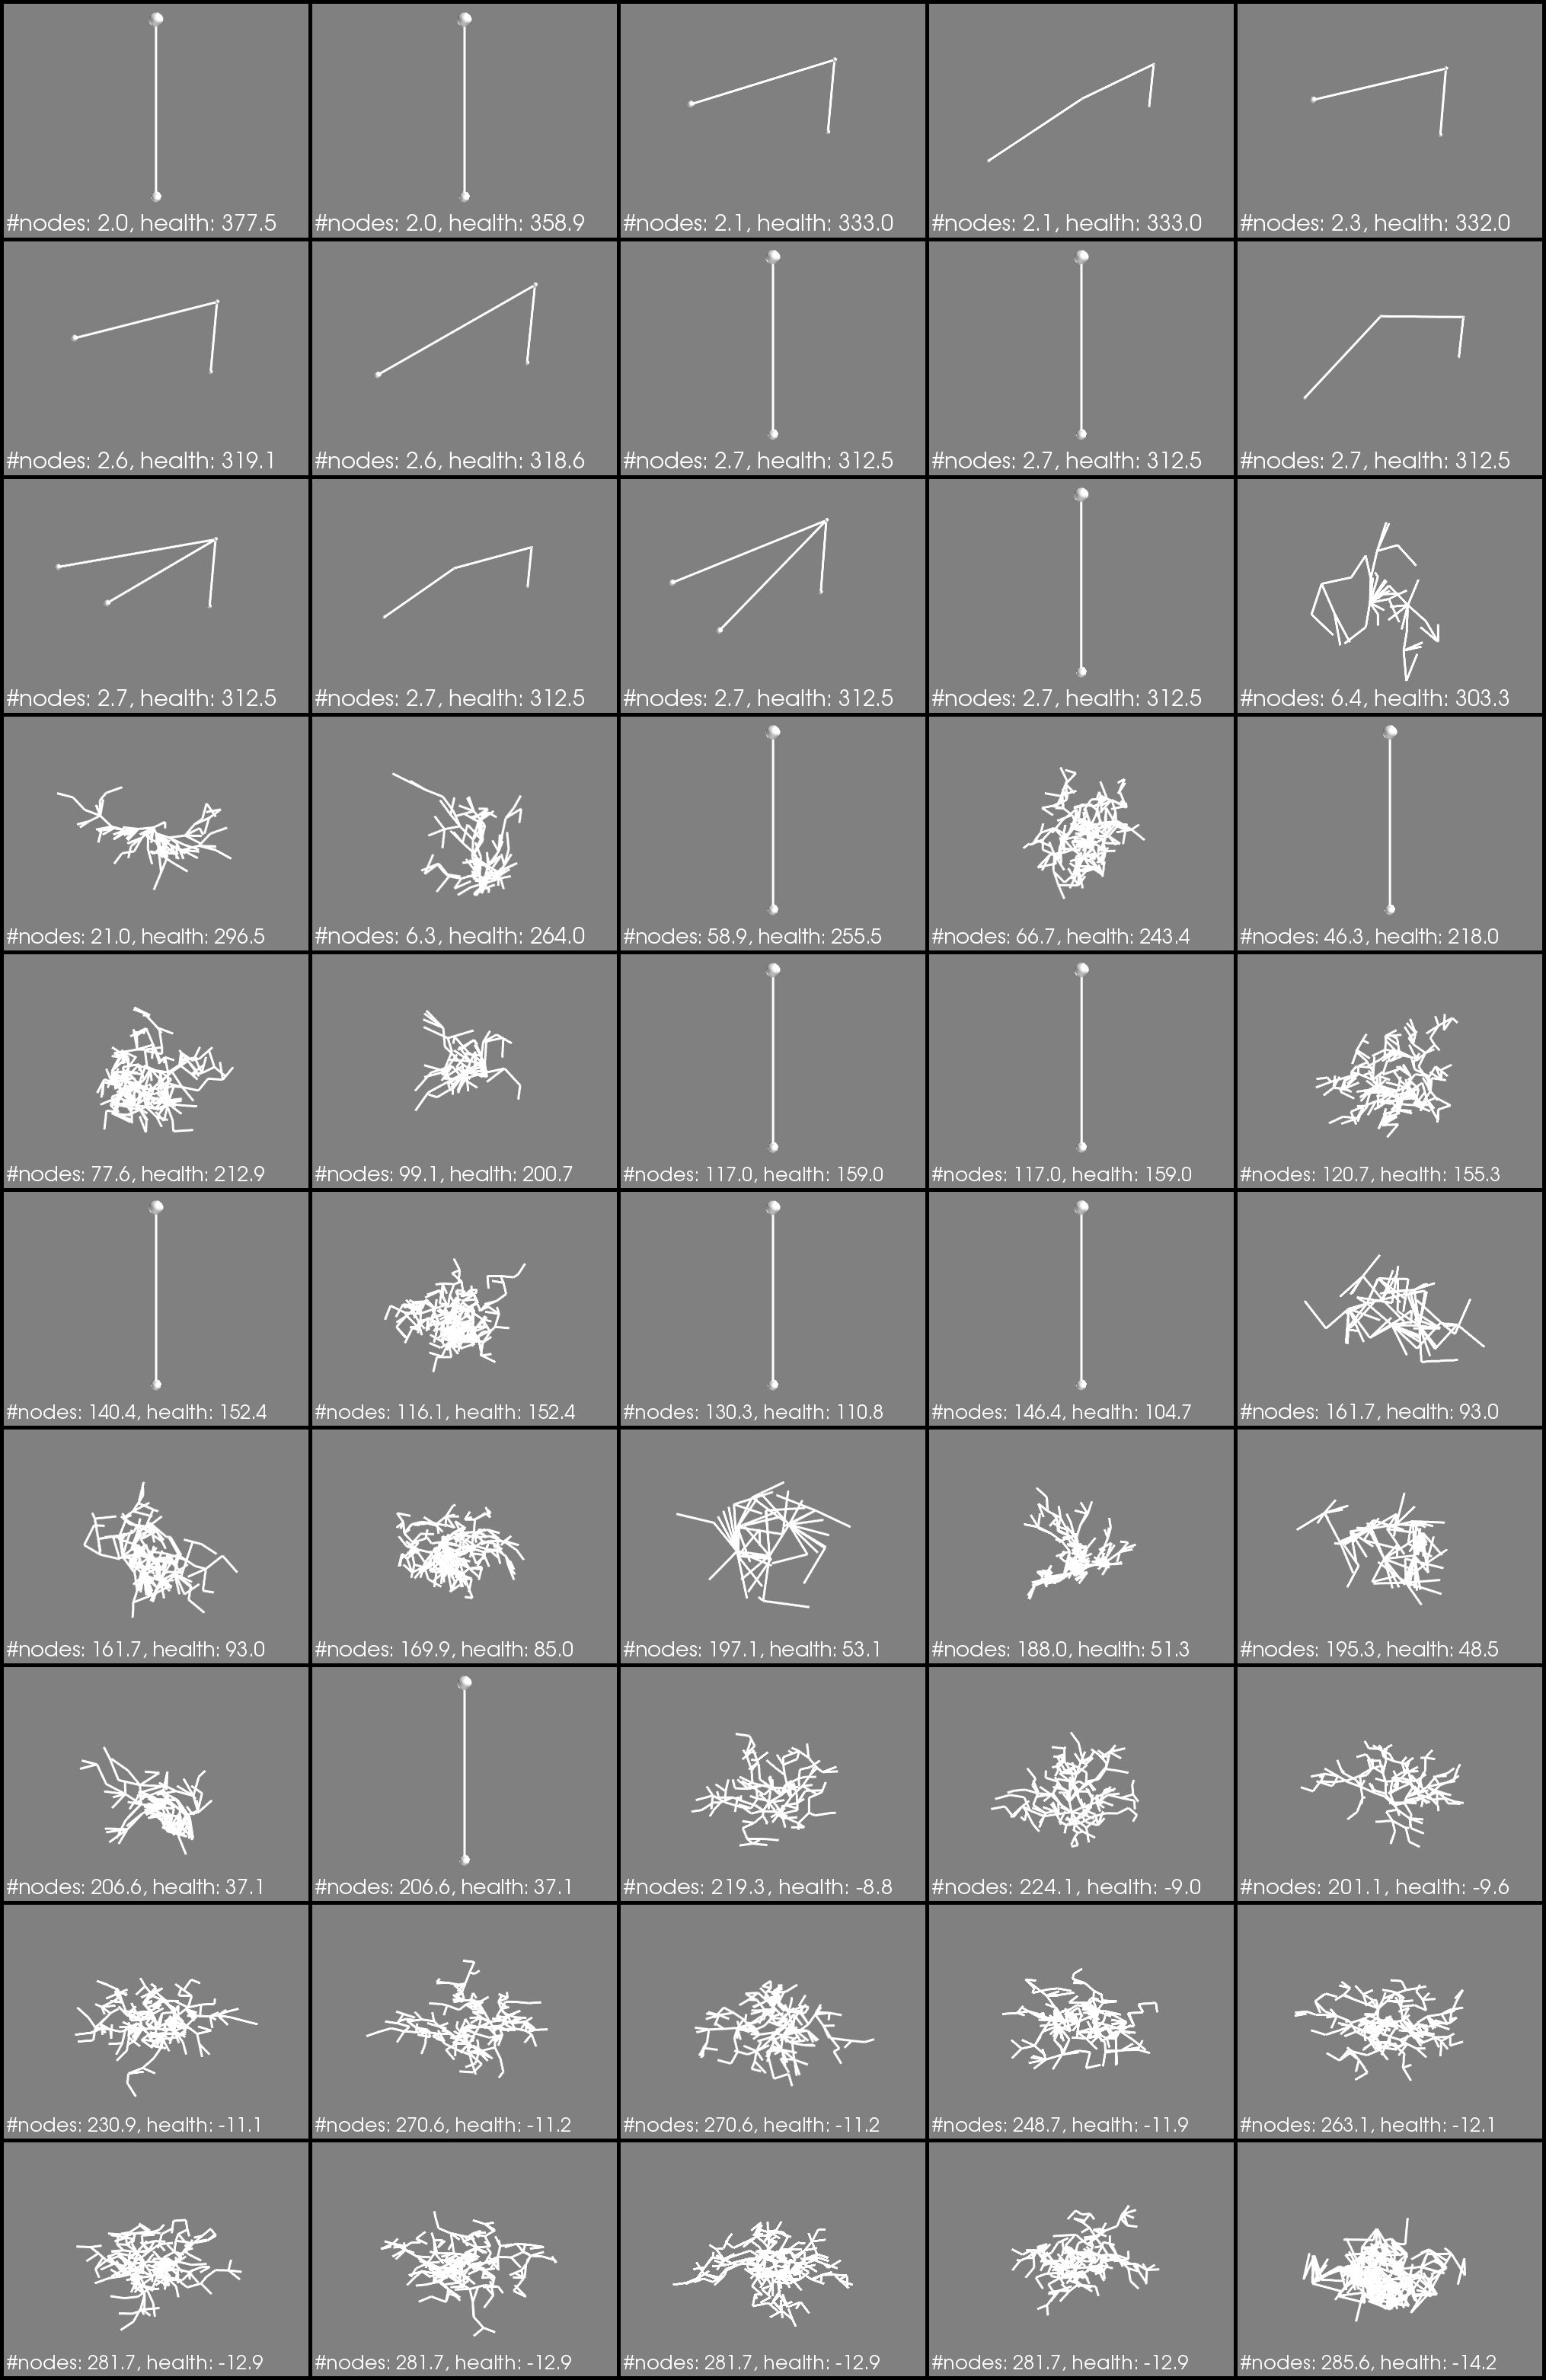
Fig4. Phenotype evaulations = 7
Notice how a bunch of boring little Q-tips are in the center of Fig4.? These correspond to the yellow dots that are way out in Fig2. If I generate a colony (phenotype) from these genomes multiple times, some times they make a bushy-shape, sometimes a q-tip. Polymorphism!
How this works I don’t know. I would need to dissect the processor trees (the genomes) of the polymorphic individuals. I would expect to see some probablistic switch that results in some precentage of phenotypes being q-tips, and some other percentage being bushy. That investigation is for another day.
I think these results are suggesting that organisms that reproduce both sexually and asexually are more likely to exhibit polymorphism. But there are a number of conditions imposed here that may be critical to that hypothesis: 1) selection operates similar to pareto-frontier selection, 2) consistent cycles of asexuall and sexuall reproduction occur.
Anecdotal evidence: The phylum Cnidaria is noted on wikipedia as being charachterized by polymorphism; many animals in this category have a polyp form and a medusa form. Cnidarians reproduce asexually as well as sexually. Things are more complicated because it seems that in some variants polyps do not sexually reproduce. Really this idea needs to be checked with biologists. I wouldn’t be surprised if this is old news to biologists, but its pretty exciting for me!
Back to All Posts