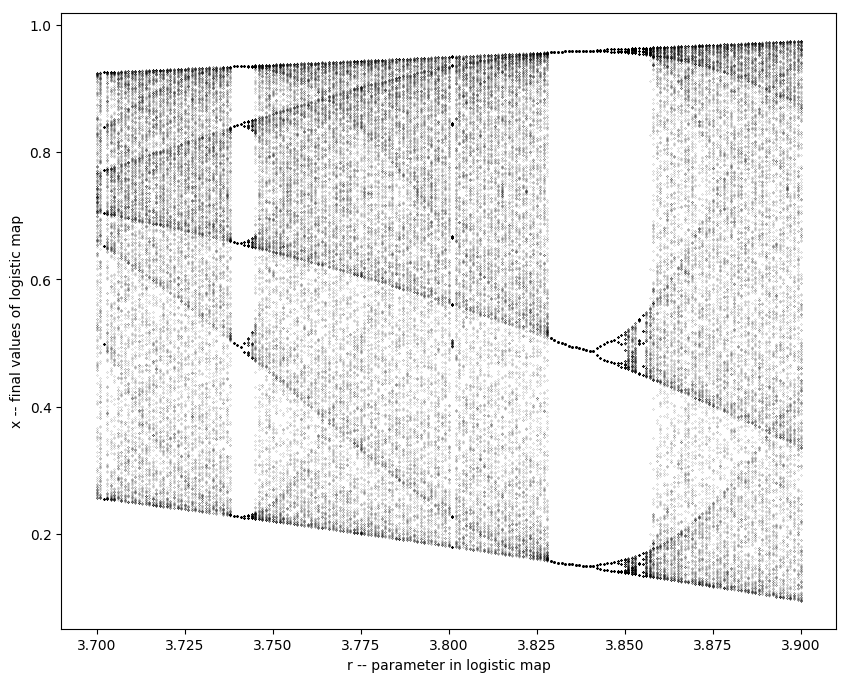
In the process of learning about non-linear dynamics I created this image:

The bottom axis is the parameter r in the logistic map:
X = r*x(1-x)
The vertical axis shows the x-values produced by running the above equation many times. The equation starts with x = 0.2 (see code for all numbers and stuff). The output X from one iteration of the map is fed back into the map as x. These X values are being plotted. For each parameter r the map is being iterated 800 times and the first 400 iterates are being hidden. This removes the changing part of the x-values, and shows where the values tend to settle (or not) over a long period of time.
So for low r the equation results in an x-value that is fixed. As r increases the long-term behavior jumps to a osciallatory behavior with a low and a high value (period-2). Then it doubles, and again and again. But the doublings get closer and closer, so it is hard to see on the plot. For higher r, the x-values never settle down into a periodic pattern. BUT if you zoom into that non-periodic region, it has periodic sections nestled next to non-periodic sections.
Not only that, there is a section with period-3. Thats the sort of empty band near r=3.8. This period 3 section seems odd. Here it is zoomed in.

Notice that there are similar bands nested in the fuzzy parts (like at r=3.8). This keeps happening as you zoom in! So non-periodic sections have little chunks of order in them.
For some r you will see the progression of x-values fall into sections of period-3, and then back into chaos, and even little sections of higher-periods leading to chaos. I am pretty sure that happens because rounding errors make it so that “super zoomed in” is not possible. My understanding is that the iterated logistic map is sensitive to those errors. Even if I type in a r-value with a ton of decimals I can’t exaclty pin down those tiny sections of order amid the “chaos”. So instead the behavior of the system has pockets of order and chaos. Holy cow!
You can see this happen using x_0 = .2 and r = 3.82 in this webapp of the logistic map
Not sure how yet how these observation can be of practical use in modeling stuff outside, but that remains to be seen!