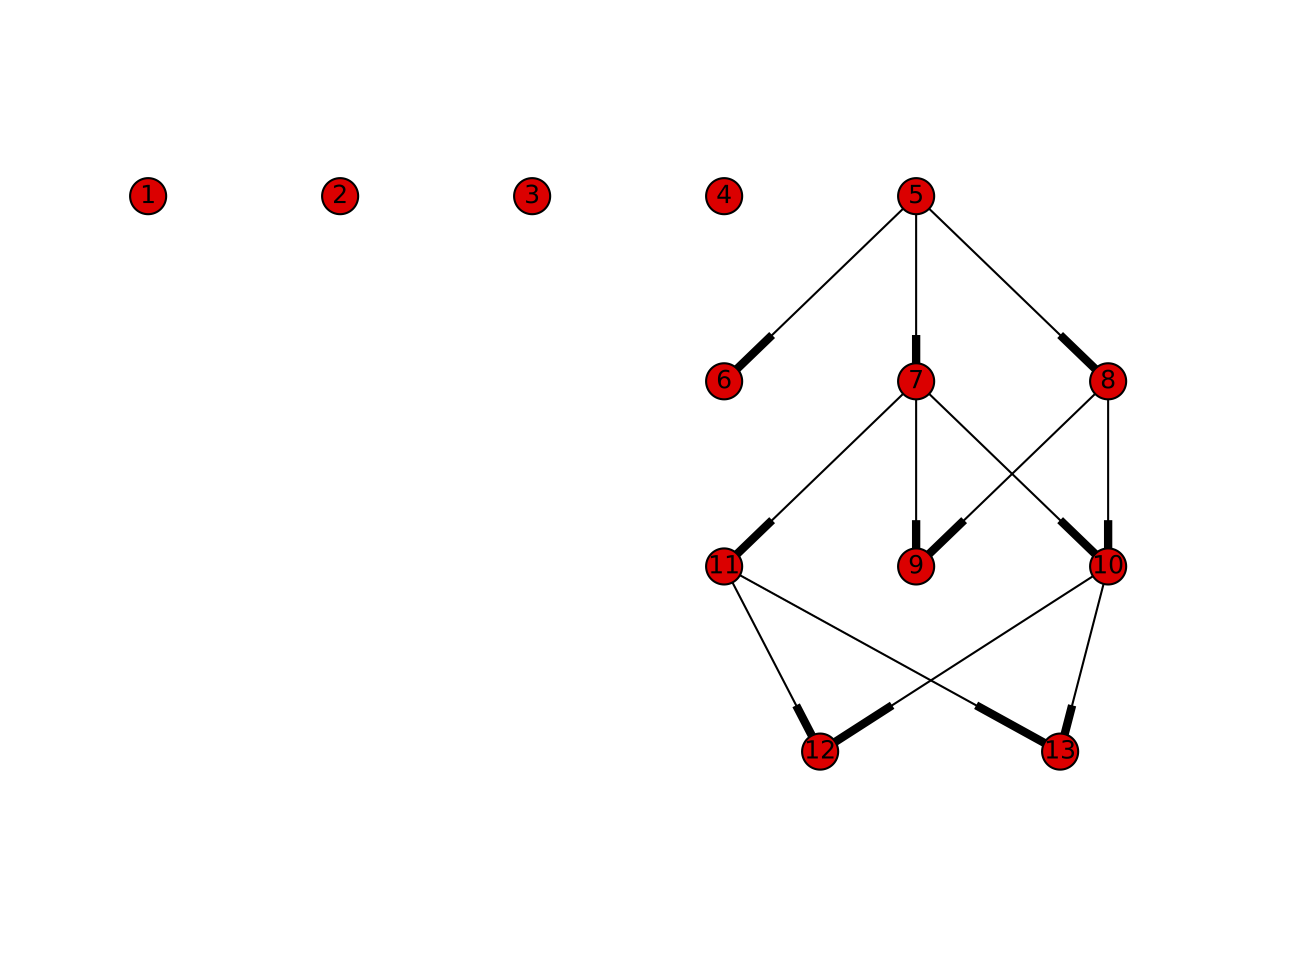
Searching around in the documentation of deap, I came across a neat example of displaying a genealogy graph (a.k.a. family tree). I ran an evolution and here is the associated genealogy graph:

Each descendent is connected to its parent or parents by a line. So individual 12 inherited genetic information from 11 and 10. In this run of the evolution there were 5 individuals in a generation and 4 generations. But there are not 20 individuals in the graph! That is because individuals that are selected to mate are kept in the next generation; their offspring replace all discarded individuals from the previous generation. So this graph doesn't really give a good impression of which individuals consistently got selected. Still this is a starting point for visualizing an evolution. This sort of visualization makes it easier for me to understand what happened in the evolution and which individuals are interesting.
A next step might be to show each generation with the parents copied over. Or perhaps a separate table showing each generation and who got selected.
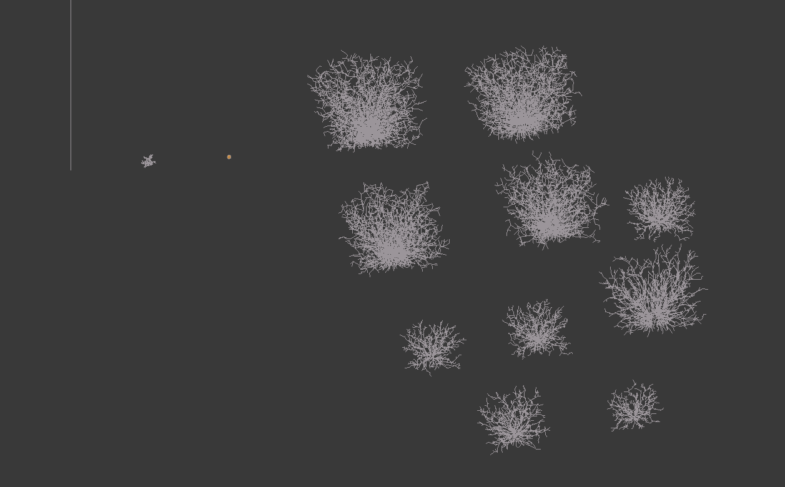
Here are the phenotypes, roughly laid-out (manually) according to the above graph:

Looks like the first two individuals produce roughly the 'best' phenotypes. (best is max number of nodes) So much for the evolution! I think its ok though; this was a small test run and it looks like I did something odd with the selection method. I used tournament selection with the size of each tournament as the population size. When looking at source code, it suggests to me that this means the next generation will consist solely of the highest fitness individual. At the moment I am using the algorithm eaSimple, a default genetic algorithm in the deap package. Anyway I'll sort out the algorithm soon, the point is that now there can be genealogy trees!
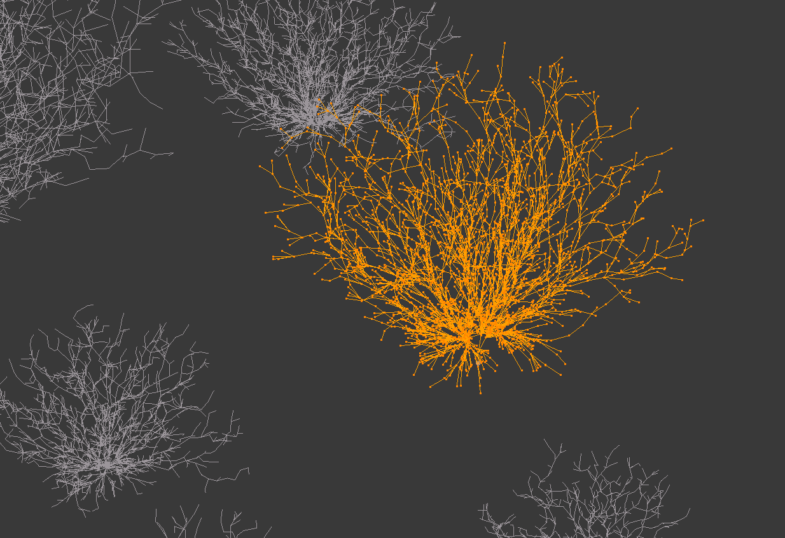
Here is a close up on a phenotype from individual 10:

looks like some of the phenotypes are a little box-like. To avoid this I should make the 'padding' between the growing plant bounding box and the world-box a little bigger.
At this point it is pretty hard to see much relation between a child and its parents. The fitness criterion of max nodes makes this visually scrambled mess. Fingers crossed that more subtle fitness criteria lead to something more visually understandable. I don't want to have to make another algorithm that 'sees' the structures! Although such an algorithm may be useful for fitness evaluation. Estimating fractal dimension seems like a natural one, although I don't have the faintest idea of how I would go about doing it at the moment.
Ok I have had enough rambling. Sorry there is not much context explained for this post! For this to make more sense check out http://joshlopezbinder.com/randomly-generated-growth-rules/